Watch a rugby league game closely and you’ll notice how much of what decides the result never makes it into the numbers.
The support runner who backs up a break and doesn’t get the ball, but drags a defender across to cover him. Who was actually involved in the lead-up to a try, three or four passes back, rather than the bloke who put it down. How quickly a player gets back to his feet and plays the ball after a tackle, which over a set is the difference between building pressure and handing it back.
None of that turns up on the stat sheets I can see. What you get is runs, metres, tackles, missed tackles. The blunt stuff.
I wanted the other numbers for a match simulation model I was building.
NRL data is hard to come by
The NRL is the main rugby league competition in Australia and New Zealand. If you want data out of it and you aren’t a club or a broadcaster, you pay for it or you go without. I’ve no idea what’s in the paid feeds. You find out once you’re paying.
Every match is filmed from a decent angle though. The information is sitting right there in the pictures. Nobody is turning it into numbers you can get at.
So I had a crack at reading it out of the footage automatically. I got part of the way. I went after the stats nobody counts and found I couldn’t reliably get the easy ones either.
There’s almost nothing to train on
If you want to build computer vision for football, you’re spoilt for choice. SoccerNet alone runs to 550 complete broadcast games with an annual challenge built on top of it. Basketball is well served. Even tennis.
Rugby league has scraps. There are a few small sets on Roboflow, a few hundred to a couple of thousand frames each. In the literature there’s a University of Auckland project with the Warriors that labelled 34,000 frames, but they’ve only published a 100-sample evaluation set from it. Most of the rugby vision work I could find trains on private footage and releases neither the data nor the code.
There’s no SoccerNet for league. No shared benchmark, nothing anyone has agreed to measure against.
There was one NRL player set on Roboflow, 2,449 images with the players boxed. Pulling and cropping frames is a job in itself, so starting from someone else’s work saved me a lot of time. The ball wasn’t labelled though, and that was the part I needed most. The player boxes weren’t all reliable either.
So I went through every image one at a time. Added the ball, checked every player box that was already there, and added the ones that had been missed. That ended up as 2,508 frames: 1,763 for training, 503 for checking, 242 held back for testing.
There was no clever shortcut, just a lot of hours checking and drawing boxes, one frame at a time.
One caveat on that 2,508, because it flatters me more than it should. There are a few matches in there, but roughly 2,000 of the frames come from a single game. Those frames came in with the set I started from, and I used them anyway. The imbalance is almost certainly part of what went wrong later.
How far the detection got
I fine-tuned an existing detection model on those frames. The scores:
mAP@50 on the held-back test frames, where 1.0 would be perfect.
Players and the referee were the straightforward part. The ball was not. In a wide broadcast shot it’s only a few pixels across, and at the model’s default input size most of them slipped through. Training at a higher resolution took the share it actually found from about a third to a bit over half. That share, not the 0.67 above, is the cap on everything downstream.
I don’t think all of that gap is the model’s fault though. Watching it back, I’d say the ball is genuinely visible from the broadcast angle maybe six or seven times in ten. The rest of the time it’s under a player, behind a body, or out of frame entirely. So finding a bit over half is a lot closer to the ceiling than it first looks.
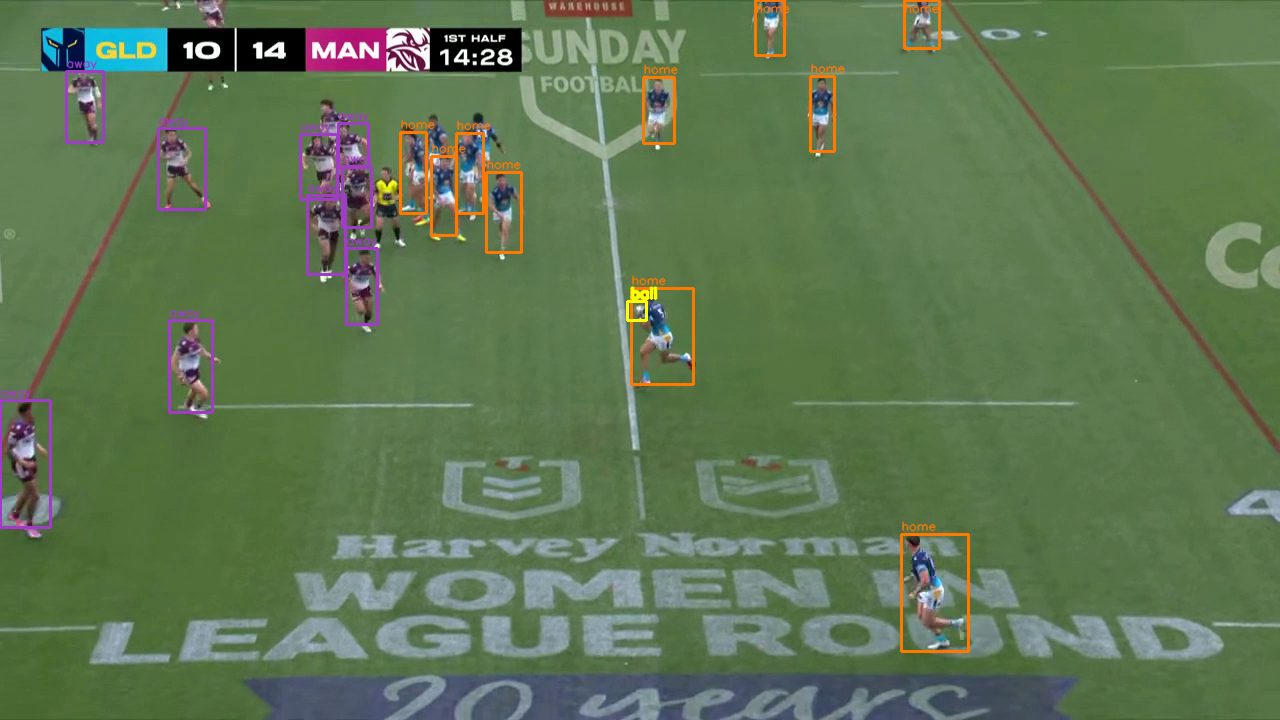
Those numbers don’t tell you how the model would cope elsewhere. They say it learned the footage I showed it. Given how much of that was one match, that’s about all they say.
Where it fell over
Finding a player is one problem. Working out which team he’s on, and what’s actually happening in the match, are different problems.
I was separating the teams by jersey colour. That sounds reasonable until you meet real footage. Lighting shifts, players run through shadow, and in one match a maroon jersey read to the model as magenta, which quietly poisoned everything built on top of it.
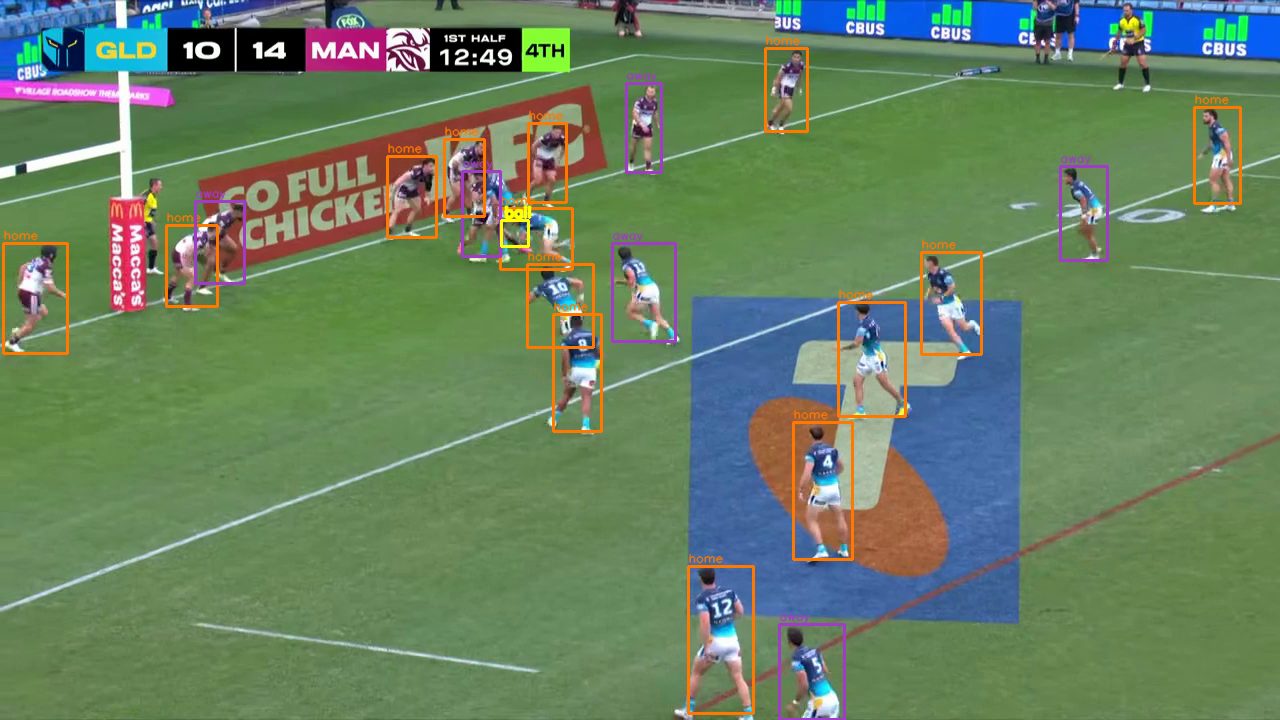
Reading match events went worse than that. I wrote rules for tackles, passes, play-the-balls, kicks and tries based on how players and the ball were moving. On a two-minute test clip it caught 17 of the 45 events that actually happened, and about half of what it did flag was wrong.
It does manage play-the-ball speed, timed and sorted into quick, medium and slow, which was one of the stats I started this for. But it only does that on the play-the-balls it actually spots, and it misses most of them. A stat that catches four in ten isn’t a stat.
Some things I didn’t attempt. A forward pass and a knock-on look much the same in a wide shot, and telling them apart needs the ball and the hand at the exact moment of release. Supporting lines and try involvements need one player followed through a passage of play, and identity falls apart the moment the broadcast cuts.
What worked: measuring, not guessing
Early on, “is this working?” was a feeling. I’d change something, watch a bit of footage, decide it looked better, move on. That isn’t knowing.
So I stopped adding things and built a scoring harness instead. It compares what the system found against events I’d labelled by hand, and prints the timestamp of every miss and every false alarm.
That took event detection from 9% to 38% in a single sitting.
I didn’t get smarter. The harness pointed at two mistakes I’d never have found by squinting at video: the magenta jersey problem, and a rule about how far the ball had to travel before I’d call it a pass, which I’d set about three times too high.
38% is still bad. It’s a measured kind of bad, where I could see which part to go at next.
What I got wrong
Three things.
I used a dataset I knew was lopsided. I’d gone through every one of those 2,508 frames, so I knew around 2,000 of them were the same game. I used it anyway, which meant nearly everything the model ever saw was the same two teams on the same ground in the same broadcast. Five hundred frames spread evenly across ten matches would have been worth more than the 2,508 I used.
I designed for a clean signal when I had an intermittent one. I read the visibility ceiling correctly. Then I wrote rules that wanted the ball at one precise instant. A pass lasts the best part of a second. I needed something that tolerated the gaps, and I tuned the rules instead.
I left the measuring until last. The scoring harness is the best thing in the project and I built it near the end, which makes most of what came before it guesswork. Next time it goes first.
None of that is specific to computer vision. I used data I knew was too narrow, designed for the data I wanted rather than the data I had, and put off measuring because I reckoned I already knew what I’d find.
Why I’m stopping
Everything left is a data problem, and most of it is the same data problem. Better ball detection needs more labelled frames, from more matches. Telling the teams apart properly needs more labelled frames, from more matches. Following a player across a camera cut needs a whole new model, trained on more labelled frames, from more matches.
It’s labelling. All of it is labelling.
Which is funny, given where I started. The stats I wanted were either paywalled or uncounted. The way out is to count them myself, by hand, for months.
The next honest step was thousands more labelled frames across a lot more matches. Months of weekends, with no guarantee the layer above would work once I’d finished. I already do this at a desk all day. On those odds it wasn’t a good trade.
The dataset and code are open
It’s all on GitHub, under The Unlicense. Public domain, no attribution, do what you like with it. The pipeline, the trained weights, the scoring harness and docs on where each layer breaks are in there. Clone it, point it at your own footage, and it will run without training anything first. Just don’t trust the stats it gives you back yet.
The dataset is on Roboflow Universe, built on the player set linked above with the ball added, and the same caveat about how much of it is one match. Labelled rugby league footage barely exists in public. It’s a start, not a finished thing.
If you want to pick it up, this is the order I’d go in.
- Ball detection, but find the ceiling first. Count how often the ball is genuinely visible across a sample of frames. If it’s six or seven in ten, the detector is already near the limit and the work is in tolerating the gaps. If it’s higher than I think, the lever is more labelled frames of the ball in contact and mid-flight.
- Replace the jersey colour matching with something learned. The pipeline already crops torso regions to read colour off, so the crops are there. Train a small classifier on them, or cluster them per match and let it find the two teams itself. Most visible failure, most tractable fix.
- Carry player identity across camera cuts. An appearance embedding per track is the standard answer. I ran OSNet over my benchmark clip, watched it come in just under a plain colour histogram, and wrote the approach off. Then I read that Auckland paper properly: they report OSNet at 22% Top-1 on rugby league, while part-based and transformer models reach around 50 to 54%. I’d picked close to the worst option going and drawn a conclusion from one clip. Their answer is part-based models pre-trained on sports data, and that’s where I’d start. Nothing spanning a passage of play works until this does, including the supporting lines and try involvements I wanted in the first place.
- Then rebuild the events layer rather than tuning mine. It’s hand-written geometry and it tops out where you’d expect. With tracked positions and labelled ground truth both in the repo, a learned approach is worth a go.
Each of those is a project in itself. You’d also have to label a benchmark clip before you’d know whether any of it helped. That’s a lot of work to rebuild something that already exists somewhere you can’t get at.
Other codes have worked that out. The NFL gives away player tracking data every year for the Big Data Bowl, and a sizeable analytics community has grown up around it. League has good people working on its data too, The Rugby League Eye Test and Rugby League Project among them. Hard not to think the game would get something back if a bit more of its data were open.
The thing I set out to build doesn’t exist in public. What the clubs have built for themselves, I couldn’t tell you.
If you get further with it than I did, I’d like to hear about it. And if the Brisbane Broncos ever have an opening to pay someone to do this for them, I’d very much like to hear about that.
LinkedIn, or [email protected]. I’ll be watching the footy either way.